
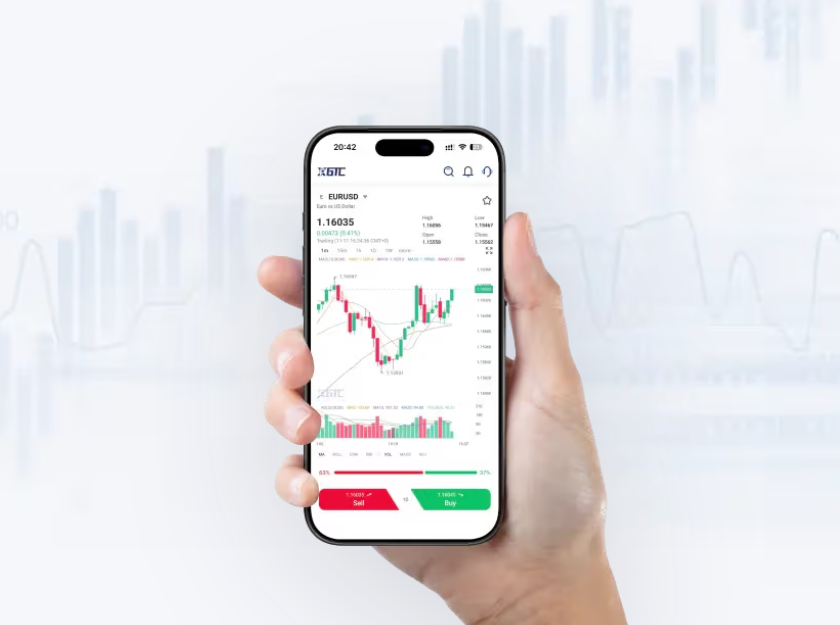
Comparing execution realities: forex versus energy CFDs
Trade execution that’s reliable in spot FX doesn’t automatically translate to energy markets—liquidity profiles, market hours, and volatility differ in predictable ways. This comparative view matters when you allocate to cfd energy, because execution style changes how positions behave under stress. Where forex often shows deep continuous liquidity, energy CFDs can concentrate liquidity at specific contract windows, and that affects spread and slippage during key moves.
Real-world anchor: what April 2020 taught markets
The April 2020 collapse in US crude futures—when WTI briefly traded below zero—highlighted execution risk under extreme conditions. That event forced many traders to reassess margin, leverage, and counterparty exposure for energy products. For anyone trading a crude oil cfd, the lessons were concrete: depth evaporates quickly, order book dynamics shift, and execution latency can turn a manageable plan into forced liquidation.
Core execution factors to compare
Approach this like a systems architect: list inputs, model outputs, and measure. Key items to evaluate include:
– Liquidity across trading sessions and instruments (spot vs front-month).
– Typical spread behavior versus realized spread during volatility.
– Historical slippage rates for market and limit orders.
– Margin calculations and available leverage per instrument.
– Execution latency and order routing paths that affect fills.
These are the metrics that show up in P&L when markets move fast—ignore them at your peril. —They reveal the difference between a theoretical edge and a usable strategy.
Common implementation mistakes and practical alternatives
Teams often reuse forex execution rules for energy CFDs and face predictable failures: oversized position sizing tied to retail leverage assumptions, reliance on market orders during thin sessions, and insufficient pre-trade checks for margin spikes. Pragmatic alternatives include using volume-weighted limit entries, staging positions across roll dates, and keeping a dynamic buffer in margin calculations.
Scaling execution: a structured three-step approach
Design a repeatable pipeline like you would a cloud deployment: define, test, monitor. First, define targeted instruments and map their liquidity windows. Second, run simulated execution with historical volatility profiles that include stress periods (April 2020 is your baseline). Third, instrument real-time metrics—spread, fill rate, and latency—and feed them into an automated alerting layer. This creates predictable capacity planning for position sizing and reduces surprise margin events.
Comparative tools and venue choices
Not all venues are equal: some offer ECN-style matching with narrow spreads but variable depth, others route through market makers with consistent spreads but potential hidden slippage. Evaluate trade-offs by running short pilot trades across venues and comparing realized execution statistics. For portfolio managers, combining venue types often yields the best trade-off between cost and certainty.
Three golden rules for selecting execution strategies
1) Measure liquidity under stress: prioritize venues that maintain depth during known shock periods rather than those optimized only for calm markets.
2) Normalize costs: track spread plus slippage per trade over multiple sessions to get an actionable cost-per-contract figure.
3) Align margin policy with roll and settlement mechanics: ensure leverage and margin buffers account for contract expiries and settlement quirks.
Closing thought and practical value
Robust execution design converts market exposure into usable portfolio tilts—measurable results come from disciplined metric tracking, venue testing, and conservative margin planning. For teams structuring energy exposure, that discipline naturally points toward providers that combine transparent execution metrics with active risk controls, and that’s where a pragmatic, measured partner like GTCFX becomes part of the solution. —Solid execution is an operational advantage.